Access your account with a secure passwordless sign-in link
Sign In
FREE for Professors
A data-driven simulation for MIS and business information systems courses
Students analyze real datasets, submit structured Action Plans, and compete turn-by-turn. You get process evidence and AI-supported feedback you can review before release.
Intro MIS/BIS · Structured Action Plans · Analysis Lab depth · AI feedback you can review before release
Team / Candidate = student group + their simulated campaign
Action Plan = four-step structured wizard (targeting, evidence, role, forecasts) before each action
Sample Section = preconfigured exploration environment for instructors
Data Acquisition = purchasing additional intelligence datasets during the simulation
The First 15 Minutes: What You'll Actually See
This is an instructor preview timeline, not how long students spend per turn. It walks through what you can verify in your first login before adopting: live section view, team evidence, Analysis Lab artifacts, structured Action Plans, exports, and whether the competitive story fits your course.
Scene: You log into your free instructor account (or sample section) for the first time:
0:00Instructor Dashboard
The dashboard loads immediately: your course, student teams, and current turn status in a clean table. No setup wizard, nothing to configure before you can see anything.
1:00Team Detail View
You click into Team Details: the team's budget, purchased datasets list, and full action history are all there. A separate Analysis Lab view shows their saved artifacts, depth scores, and how many action plans linked to each artifact.
3:00Analysis Lab Replay
You open a saved Analysis Lab artifact: the filter conditions, matched record count (2,300 from 50,000 rows), and dataset used are preserved. An Analytical Depth badge (L0–L3) shows the rigor level. You see how many action plans linked to this artifact and can download the result summary.
6:00Structured Action Plan Review
You open the submitted plan: targeting groups built from data fields (or imported from a saved Analysis Lab profile), linked datasets with evidence findings, a strategic role, and numeric outcome forecasts. AI feedback scores the structured plan against Analysis Lab depth, purchase history, execution, and competitive context, not a pasted essay.
9:00AoL Dashboard
The Analysis Lab view shows every team's saved artifacts with depth badges, contributor counts, and plan-link rates. An export gives you team name, turn, action type, evidence depth, strategic role, expected outcomes, and score for every submission.
12:00Leaderboard Check
Teams that did the most rigorous analysis are not all winning. Some high-depth teams over-targeted. Some low-depth teams got lucky. You make a note: this will be a good discussion point in class.
15:00You Assign It
You decide to assign it. You set the turn deadline for next Thursday. Students will get an email. You go make coffee.
What MIS / BIS professors usually want to know first
Does this teach real analytical work, or just run a game?
That is the adoption question this page should answer quickly. MISsimulation is built to show faculty three things early: the data is rich, the decisions are evidence-driven, and the competitive, resource-constrained environment forces students to think strategically about ROI, allocation, and timing.
🗂️ Rich dataset ecosystem
17+ named datasets across foundational, financial, behavioral, social-network, and recurring intelligence layers, not a single prebuilt dashboard.
🧠 Competitive resource allocation
Students decide what data to buy, where limited budget will earn the best return, which segments are worth pursuing, and when a competitor's weakness is worth attacking.
📋 Assessment-ready instructor view
Reasoning scores, instructor review/override, participation signals, and CSV exports support grading, AoL reporting, and accreditation documentation.
Does this teach real analytical work, or just run a game?
Rich datasets, evidence-driven decisions, and scarce-resource competition — not a single dashboard game.
Rich dataset ecosystem
Competitive resource allocation
Assessment-ready instructor view
Product proof
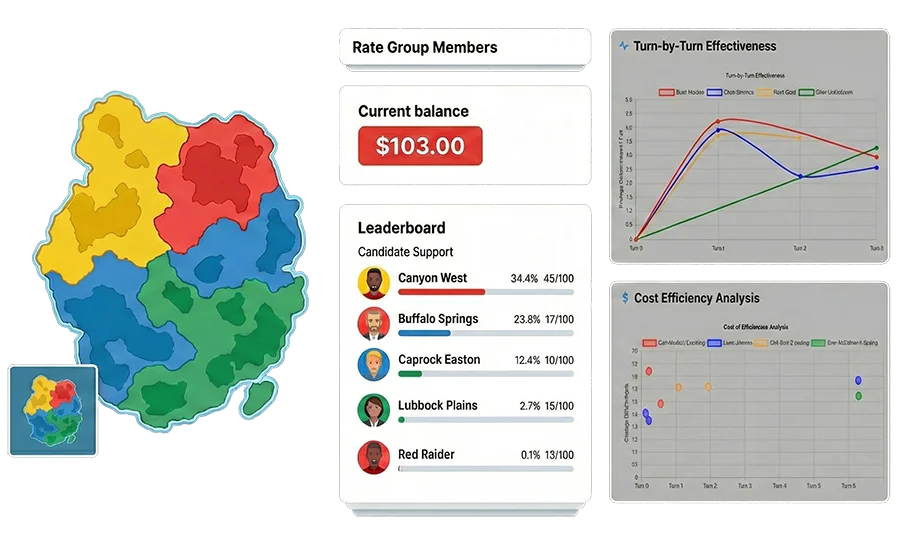
What students and instructors actually use
A quick visual sense of the experience: competitive student work, strategy context, and the instructor role—before you dive into the full walkthrough.
Why a campaign simulation works for MIS and business information systems teaching
The election theme is the setting, not the learning objective. Students practice the analytical and managerial tasks MIS courses are built around, in a context that feels concrete and competitive rather than abstract. Critically, students must make <strong>information-acquisition decisions</strong>: what data to purchase, when to research rather than act, and how to combine multiple sources into an actionable model. Because resources are limited and competitors are acting at the same time, students cannot go after everything. They have to allocate scarce budget, choose the highest-yield targets, and adjust when the competitive landscape changes.
→Working with structured CSV datasets and inspecting raw data
→Segmentation in Excel, Google Sheets, or the built-in Analysis Lab, with logged depth for instructor review
→Cost/reach tradeoffs, ROI thinking, and scarce-resource allocation
→Decision support under uncertainty - buying data, weighing options
→Evidence-based reasoning: explaining decisions with data, not intuition
→Iterative strategy: measuring results and improving decisions turn over turn
→Information-acquisition decisions: choosing which datasets to purchase, when to invest a turn in research, and how to manage intelligence costs against budget
→Joining multiple data sources: combining voter, financial, and behavioral files into a single decision model - the integration work analysts actually do
→Reasoning from behavioral proxy data: working with spending patterns, utility behavior, and service-complaint signals, not only direct survey answers
→Strategic targeting under pressure: choosing where not to spend, because limited budget makes prioritization part of the learning
→Competitive response: reading rival movement, spotting weak areas, and countering where the data suggests the highest return
Why Instructors Choose MISsimulation
📊
Rich Dataset Ecosystem
Students work across 17+ named datasets, including behavioral proxy signals and recurring intelligence, closer to real analytics than a single spreadsheet exercise.
🤖
Reasoning Assessment You Control
The AI scores use of evidence, realism of predictions, and quality of reasoning. Score overrides with a required justification are available for grade management.
📈
Assessment & AoL Reporting
Export per-student grades, reasoning indicators, and participation data into your gradebook or AoL workflow. Useful for AACSB-style direct measures.
🎓
Flexible Course Control
Choose turn count, pacing, modules, datasets, language, and grading emphasis, then explore a free sample section before adopting.
Why Instructors Choose MISsimulation
Rich Dataset Ecosystem
17+ datasets students must choose and combine.
Reasoning Assessment You Control
AI scores evidence use; you can override.
Assessment & AoL Reporting
Export grades and participation for your gradebook.
Flexible Course Control
Turns, modules, and pacing you configure.
For Colleagues and Faculty
Know a colleague or professor who teaches MIS, analytics, or a related course?
If this simulation looks like a fit for a colleague, you can send them a quick recommendation. It takes about 30 seconds and helps them discover the tool on their own terms.
Students receive a <strong>course code</strong> from you (shared via LMS or syllabus). They go to missimulation.com, enter the code, pay the $28.99 USD semester access fee, and land directly in their team dashboard. No software to install.
Reinforces: digital onboarding literacy, low-friction system access
✓ Works on any device
✓ Institutional email accepted
✓ Team assigned automatically
2
Acquire & Analyze the Data
~30–60 minutes outside class
At the start of each turn, students access one or more CSV datasets from their dashboard, download for spreadsheet work or analyze in the built-in Analysis Lab. Datasets are uniquely generated for their island (Misland), different every course run. Optional datasets are purchased with each team's in-simulation campaign budget, so students must decide which intelligence is worth the spend, when to invest a turn in primary research, and how to combine multiple sources into an actionable model.
Reinforces: data literacy, segmentation, business intelligence thinking, data integration, information-acquisition decisions
📦 Dataset Ecosystem: 5 layers, 17+ named files
🏛️ Foundational (always available)
Registered Voters List · Household Address List · Area Profiles
💰 Financial & Socioeconomic (purchasable with in-simulation budget)
House Mortgage List · Financial Well-Being Dataset · Vehicle Registry · Vocational Registry
🔍 Behavioral Proxy (purchasable with in-simulation budget)
Merchant Consumption Index · Utility Innovation Report · Citizen Service Logs
Spending patterns, utility behavior, and service-complaint signals act as revealed-preference proxies, closer to real analytics than survey answers alone.
📡 Social Network (when microblogging enabled)
Microblogging User Base · Follower Network · Post Archive · Candidate Followers
Students identify high-reach influencers and model diffusion vs. direct outreach.
Data that changes turn-over-turn - students learn to distinguish stable baselines from evolving intelligence.
🔍 Spreadsheet path (Excel or Google Sheets)
Filter records by income bracket and region
Calculate cost-per-reach across target segments
Cross-reference support data with demographics
Use VLOOKUP / XLOOKUP to join datasets across files
Build pivot tables to compare segments by geography
🧪 Analysis Lab path (in-platform)
Select a starting dataset and preview row counts before acting
Build filters and cross-dataset conditions; save a segment profile
Attach the saved profile to outreach, survey, or fundraising actions
💡 Students make information decisions, not just campaign decisions
Which datasets are worth spending part of the team's simulation budget on?
Which segment offers the best expected ROI under limited resources?
Is it smarter to research this turn or act before a rival does?
Where is a competitor vulnerable enough to justify a targeted response?
Datasets include static files available from Turn 1, recurring files that update across turns, and intelligence files generated by survey and fundraising actions.
3
Submit Decisions + Structured Action Plan
~15 minutes
Students return to the platform and queue their actions for the upcoming turn. Because every turn happens inside a competitive landscape, teams must decide where scarce resources go, which segment promises the best bang for the buck, and whether to press an advantage or respond to a rival move. Each turn, a team can submit one offline action plus one optional online action if microblogging is enabled:
Reinforces: decision-making under constraints, competitive strategy, evidence-based reasoning, structured planning
Before each action runs, teams complete a guided four-step Action Plan wizard, not a free-text essay. The wizard is layered on Analysis Lab work: students can import a saved Lab profile as their audience, link datasets they purchased, and attach Lab research readouts. An optional student note field is for their own reference only and is not graded.
Offline Action (one per turn - choose one)
Campaign action - targeted outreach using uploaded address list or area selection, issue choice, optional negative/rival targeting where enabled
Survey action - gather fresh intelligence using a targeted resident list; returns issue preferences, support signals, and demographic breakdowns
Fundraising / contribution drive - raise campaign budget by targeting likely donors with financial capacity; uses uploaded donor list
Online Action (optional, when microblogging is enabled)
Regular post - message broadcast to existing followers in the social network
Promoted post - targeted to specific handles using an uploaded list; reaches beyond existing followers
Offline and online actions are separate slots - teams can do both in the same turn.
Structured Action Plan (four steps, every action)
Step 1: Who are you targeting?
Build targeting groups from data-field conditions, or import a saved Analysis Lab profile as the audience for this action.
Step 2: What supports your plan?
Link purchased datasets with evidence findings; pick a strategic role and why-now drivers. Analysis Lab research from saved segments can appear read-only here.
Step 3: What do you expect?
Enter structured forecasts (reach, survey response, funds raised, engagement, etc.) matched to the action type, not open-ended prose.
Step 4: Review your plan
Confirm targeting, evidence, role, and forecasts before submit. The platform stores structured JSON for grading and exports.
Example structured inputs (outreach action):
Targeting: East Region + income ≥ $120K (2 groups, 2,300 rows matched)
Evidence: Financial Well-Being + Independent Survey linked; role = Persuade; why-now = competitor surge in North
Forecast: +3–4 point score lift in East Region; cost-per-reach within budget
4
AI Evaluates the Structured Plan + Process Evidence
Automatic after turn processing
After teams submit, AI scores each structured Action Plan (Strategic Approach and Expected Results components) and cross-checks it against verified process evidence: Analysis Lab analytical depth and filter trails, datasets actually purchased, whether targeting matched execution (including mass-outreach detection), and competitive context. Feedback cites numbers from the simulation, not generic praise for writing style. You control when results release; score overrides require justification.
Targeting specificity, segment conditions or imported Lab profile vs. who was actually reached
Evidence quality, linked datasets, findings, and consistency with purchase ledger
Analysis depth, Analysis Lab artifacts, filters, joins, and L0–L3 depth where applicable
Strategic fit, role, timing, competitive landscape, and forecast vs. actual outcomes
Strong, 8.7/10
AI: East Region targeting matches your linked Financial Well-Being evidence; Lab depth L2 shows multi-condition segmentation. Forecast band was realistic; execution reached 3,240 contacts at strong efficiency. Consider shifting 15–20% budget to lower-density segments where cost-per-reach is 2.4× urban average.
Weak, 4.1/10
AI: Suburban segment selected without a linked dataset finding. Analysis Lab shows no filters applied before upload; purchase ledger does not include the demographic file cited in evidence. Execution pattern suggests broad outreach, add Lab-based segmentation and link supporting datasets before the next turn.
5
Students See Results & Standings
After turn deadline closes
When you release turn results, students review outputs for whatever action type they submitted - campaign results, survey findings, fundraising returns, or online engagement effects - alongside AI reasoning feedback and competitive standings. They can see which teams achieved the highest return on limited resources, which strategies drove lower cost and higher yield, and whether a response to competitor behavior actually paid off.
Reinforces: performance measurement, competitive benchmarking, ROI interpretation, results analysis
+847
Effectiveness score
$4.96
Cost per point
3,240
Residents reached
#2
Team standing
Survey actions return completed survey responses and demographic breakdowns. Fundraising actions return total raised, average gift, and net gain after action cost. Online actions return reach, reposts, and follower-growth effects when microblogging is enabled.
What You See as the Instructor
Real-time throughout the simulation
While the simulation runs, you have a real-time view of your section. This is what instructor-facing analytics looks like in practice:
📊 Section + Team Analytics
View team performance trends, action effectiveness patterns, competitive-response choices, and data-use indicators across the section. Surface outliers and strong analytical approaches at a glance.
🧑💻 Participation and Engagement Signals
Active minutes per student, inactive student flags, participation balance inside teams, top-contributor and needs-attention indicators. Useful for managing free-rider risk and fairness concerns.
📥 Grade Export (CSV)
Export a per-student grade file at any point in the simulation. Import directly into your gradebook or use in grading, AoL, or accreditation reporting workflows.
How a turn works
Students acquire data, analyze it, submit a structured Action Plan, get AI-supported feedback you control, then review results. The loop repeats each turn.
Steps 2–5 repeat for each turn (4–13 turns depending on your settings).
Each turn, students review their results, compare against competitors, and can refine their approach. The competitive standings give everyone a concrete reason to engage with the data.
Acquire data → Analyze & integrate → Form a hypothesis → Act → Measure results → Improve next turn
Built for assessment, not just engagement
For professors and program administrators, the platform is useful because the analytics can double as evidence of learning, not just a game scoreboard.
📏 Direct measure of analytical reasoning
Structured Action Plan scores plus Analysis Lab depth (L0–L3) show whether students built real segments, linked evidence, and forecast outcomes, not whether they wrote a convincing paragraph.
📤 Exportable grading / AoL evidence
Per-student exports support gradebook import, AoL binders, and accreditation conversations without manual re-entry.
🧑🏫 Instructor judgment stays central
You control when results are released to students, can override individual scores with a required justification, and blend competitive performance, participation, and reasoning quality in your rubric.
Pedagogical Design
What Separates A Students from C Students
The simulation has a 4-tier analytical maturity ladder built into its mechanics. Students who reach Level 3 aren't just winning - they're demonstrating the analytical thinking employers actually hire for.
Level
Name
Behavior
Competitive Outcome
0
Intuition-Based
No data use; mass marketing approach
Poor targeting, low ROI
1
Single-Variable
Applies basic filters on one dataset for broad trends
Moderate effectiveness
2
Multi-Variable
Applies two or more conditions, or uses a presence-based filter or explicit dataset selection
Good targeting efficiency
3
Thorough Analysis
Combines two or more conditions with a presence filter or explicit dataset, building a precise multi-factor segment
Maximum competitive advantage
The leaderboard makes analytical quality visible in real time. Teams that guess get outcompeted by teams that analyze. That competitive pressure is what makes data work feel necessary rather than theoretical.
Flexible Enough for Any Course Format
Configure turns, modules, and activation timing to match your course level and learning goals.
⏱️ Turn count + pacing
Run a 4-turn unit or a 13-turn semester experience.
🧩 Modules + datasets
Enable the foundational experience or add fundraising, surveys, social media, and advanced dataset tiers.
📝 Grading emphasis
Blend reasoning quality, participation, and competitive performance the way your course requires.
🌍 Language + section setup
Configure section language, timing, and activation rules to match your delivery format.
📘 Intro MIS
4–6 turns, standard module set, practice mode available for first-time users. Emphasis on data literacy fundamentals and structured decision-making workflow.
💻 Business Computing
Emphasizes CSV-to-decision workflows: spreadsheet skills (filters, joins, pivots) or Analysis Lab segmentation, plus cost-per-reach modeling. AI reasoning scores support grading on analytical process and competitive results.
🔬 Advanced MIS / Business Analytics
6–13 turns with expanded dataset tiers (financial, behavioral proxy, social network), multi-source data integration, and advanced instructor analytics. AI reasoning scores and grade exports support assessment and documentation.
🎓 Capstone / Integrative
All dataset layers active, debrief materials for deeper learning integration, and exportable per-student data to support grading and AoL documentation.
Start with a free sample section
Instructor access is free. Explore the full platform before you decide how to configure it for your course.
1
Create your free instructor account
No credit card. Takes about 2 minutes.
2
Explore a preconfigured sample section
See the full student and instructor experience before you set anything up.
3
Configure your course section
Set number of turns, modules, pacing, and language. Use a preset or customize.
4
Share the section code with students
Post it in your LMS, syllabus, or email. Students join in under 2 minutes.
Supporting materials included
Assignment templates, grading rubrics, sample discussion prompts, a student quick-start guide, and onboarding help are available once your instructor account is active.
Common questions from instructors
Each turn, students access CSV datasets, analyze them in Excel or Google Sheets or in the built-in Analysis Lab, allocate resources across target segments, attach a saved Lab profile or upload a filtered list for targeted outreach, and complete a structured Action Plan. After the deadline closes, you release results and AI-supported feedback. Weekly time typically ranges from 15 minutes to over an hour depending on depth and your section settings.
No. The simulation runs in any web browser. Students can analyze data in Excel, Google Sheets, or similar, or use the built-in Analysis Lab without installing spreadsheet software.
You can grade on any combination of competitive performance, participation, and reasoning quality. The platform provides per-student data exports and AI-supported reasoning scores that you can use as grading inputs alongside your own rubric. Instructor materials include sample grading templates to help you get started quickly.
The AI evaluates each structured Action Plan against simulation evidence, not a standalone essay. It checks targeting groups or imported Lab profiles, linked datasets and findings, strategic role, forecasts, Analysis Lab depth, purchases, execution, and competitive context. Scores include Strategic Approach and Expected Results components plus qualitative feedback. Review via exports and section analytics; overrides require justification. Final grading authority stays with you.
The simulation is configurable for different formats. You can run a focused 4-turn unit over a few weeks or expand to 13 turns across a full semester. Pacing, turn frequency, and module depth are all adjustable. Many instructors run it as a 4–6 week segment within a longer course.
The framing works because students already know what a campaign is - so the rules and stakes are immediately intuitive. That familiarity lets the course focus on the analytical skills rather than spending time explaining a business context. Instructors typically frame it as: "We are using a campaign competition as the vehicle because it creates the exact pressure - budget limits, incomplete data, competing teams, performance accountability - that makes data analysis feel necessary rather than theoretical."
Basic spreadsheet comfort is enough for the export path, open a CSV, filter, simple arithmetic. Students who use Analysis Lab can build segments in-platform with guided steps. Advanced students can go deeper with pivots, joins, or multi-dataset Lab profiles.
Yes. The student dashboard, AI feedback, and instructor console are available in English, French, Spanish, Russian, Portuguese, Arabic (with RTL), Chinese, and Hindi. Instructors can lock section language or allow student choice.
Yes, when microblogging is enabled. The offline slot (campaign, survey, or fundraising) and the online slot (microblogging) are separate - teams can use both in the same turn. The exclusivity is inside the offline slot: a team can do a campaign action or a survey action or a fundraising action for that slot, but not more than one. The online slot is independent.
All three use the offline action slot - so choosing to run a survey or a fundraising drive means not running a campaign action that turn, which creates a real strategic tradeoff. A survey action targets a resident sample and returns fresh issue-preference and demographic intelligence - useful before a big spend. A fundraising / contribution drive targets likely donors and returns dollars raised, average gift amount, and net gain after action cost. Students must plan the Expected Results differently for each: support-lift predictions for campaigns, response-rate and insight expectations for surveys, dollar-return expectations for fundraising.
Students complete a four-step structured Action Plan wizard before each action, not free text. Step 1: define targeting groups from data fields or import a saved Analysis Lab profile. Step 2: link purchased datasets with evidence findings, choose a strategic role, and select why-now drivers (Lab research can preload here). Step 3: enter structured outcome forecasts for that action type. Step 4: review and submit. AI feedback scores the plan against Lab depth, purchases, execution, and competitive results. An optional note field is not graded.
The simulation includes 17 or more named datasets across five categories: foundational (Registered Voters, Household Address List, Area Profiles), financial and socioeconomic (House Mortgage List, Financial Well-Being Dataset, Vehicle Registry, Vocational Registry), behavioral proxy (Merchant Consumption Index, Utility Innovation Report, Citizen Service Logs), social network (Microblogging User Base, Follower Network, Posts), and recurring public-signal datasets (Independent Survey, Lawn Signs, Residents' Contributions). Some are available from Turn 1 at no cost; others must be purchased using the team's in-simulation campaign budget. That purchase decision is itself a learning objective: students must weigh whether additional intelligence is worth the cost before acting. This is one of the clearest ways the simulation teaches information-systems thinking - students are not just consumers of a pre-given dashboard. They decide what information is worth acquiring.
After the section is configured, the weekly instructor workload is usually light: monitor submissions, review AI-supported reasoning feedback, and release results on your schedule. Many instructors use the exported grade data and built-in analytics to reduce manual grading time rather than add to it.
You can start with a free sample section, use the included assignment templates and grading rubrics, and request a walkthrough if you want help mapping the simulation to your syllabus. The goal is to let you evaluate the full instructor experience before you commit to a live section.
Ready to See It With Your Own Login?
A free instructor account gives you the full simulation experience - all screens, all data, all AI feedback - with no obligation.